Introduction
This report provides an introduction into an increasingly important input for modern construction – building boards. We focus in particular on how building boards composed of secondary paper sludge waste can act as a financially viable alternative to plasterboard, while increasing the rate of decarbonisation within the construction sector.
The construction sector is fundamental to developed and developing economies alike, and is responsible for building crucial residential, commercial and industrial property. While construction is vital, it comes at a significant environmental cost, producing 35-40% of the world’s greenhouse gas emissions (UN). As the global economy develops, this environmental impact will only increase without innovation in key building products.
The first section of this report, ‘Building Board Basics’, provides background information on what building boards are, how they are used, desirable qualities and the current available products.
The second section, ‘Building Board Demand’, covers an overview of global demand, application and trade statistics, factors influencing demand and some key regional markets.
The third section, ‘Net Zero Building Boards’, examines plasterboard’s carbon footprint and strategies to reduce these emissions at each stage of the products lifetime.
The final section, ‘Boards From Secondary Paper Sludge Waste’, considers the sources of recycled paper waste globally and the key factors which will affect the price and supply of the waste product. This section concludes with a case study about a carbon-negative building board, EnviraBoard.
Section 1: Building Board Basics
What are building boards and how are they used
This section covers what building boards are, how are they used, desirable qualities, and the different types of board.
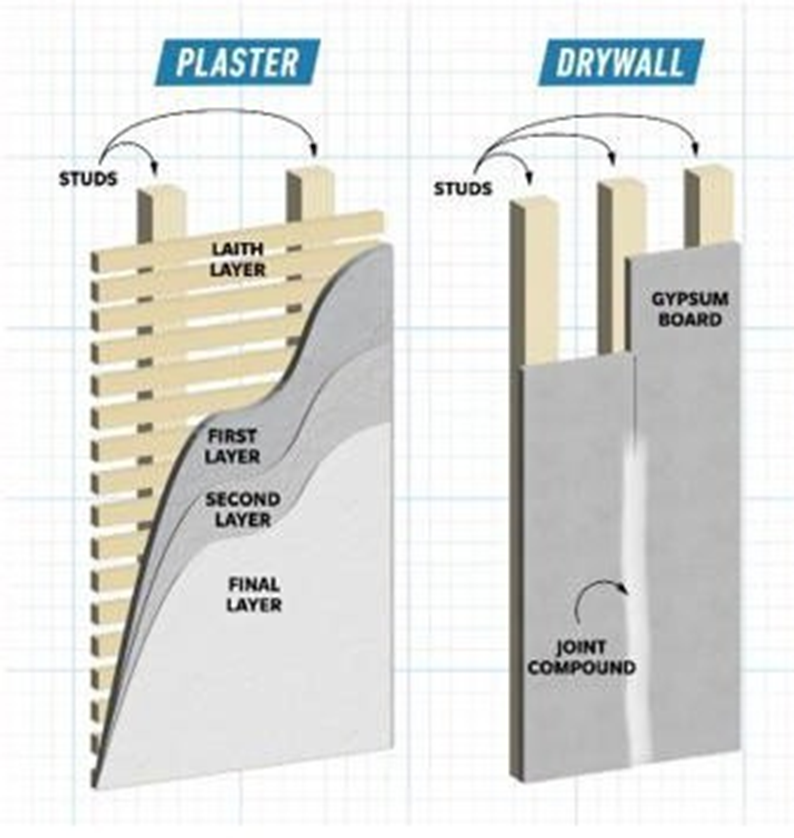
Building boards are prefabricated panels used as an interior surface covering material in commercial, residential and industrial construction. Building board comes in a variety of dimensions, with a typical European sheet being 2400mm x 600mm x 12.5mm. The most common example of a building board is plasterboard (also known as drywall), a panel made from gypsum plaster pressed between two sheets of cardboard.
Since the mid-20th century, building boards have replaced traditional lath and plaster walls, mainly due to the labour-intensive process of plastering. Some examples of how modern construction uses building boards are the following:
Studwork – As in Figure 1, sheets of building board can be screwed to a wooden or steel frame to create a low cost, easily to finish, wall.
Lining internal masonry walls – Building board can be attached to masonry walls such as brick or block.
Ceiling lining – Since the 1960s plasterboard become virtually the only material used for ceiling lining (The Evolution of Building Elements, 2009).
Architectural features – Building boards are used to create arches, curved walls and conceal structural beams.
Insulation – Insulated plasterboard is typically used to line internal brick walls to provide both lining and insulation. This avoids having to install regular installation followed by standard plasterboard. Other types of plasterboard exist, such as moisture-resistant or acoustic board, however the standard variety is the most widely used.
Desirable building board qualities
Broadly the three following categories determine how attractive types of standard building board are: Functional, Financial and Environmental. The attributes within these categories are explained below:
Functional:
Fire resistance – Building Regulations require that building boards can withstand a given exposure to fire, for example 30 minutes. Common verification of suitable fire resistance is approval by the European Technical Assessment (ETA) and obtaining a European Conformity (CE) marking. Having greater fire resistance allows fewer boards to be used, increasing the interior space available.
Sound absorption and acoustics – Building Regulations in the UK and EU require a minimum level of soundproofing which building boards can help achieve. Higher density panels typically absorb more sound. For common residential studwork, the National House Building Council (NHBC), a UK approved inspector for Building Regulations, mandates two layers of 12.5mm plasterboard with a minimum weight of 10kg/m2 (NHBC).
Screw retention – Higher screw retention is desirable, with heavier shelves or other fittings, able to be attached.
Strength/Impact absorption – Increased impact absorption means the board is less likely to dent or break if it receives impact.
Financial:
Board cost – Clearly the price of the panel is an important determinant of how widely it is adopted by the construction industry. Prices are typically quoted per metre squared (for a given thickness).
Ease of finishing – How much effort is required to go from plasterboard to a finished wall surface all contributes to the cost. For example. some boards are ‘skimmed’ with plaster for a suitable finish, which adds to the cost per metre squared of finished wall. Ultimately the cost of finished wall per square metre is the main determinant of a contractor’s decision to use a given building board. This has important financial and environmental implications as illustrated in Section 4.
Ease of installation – This is the process of mounting the building board to the wall, typically using screws. Before fixing, often the board requires cutting to size, so ease of cutting is important.
Ease of filling – During installation of plasterboard the joints between plasterboard edges need to be filled to provide a smooth finish. Typically boards used for walls have a tapered edge (meaning the edge slopes slightly at the join), allowing for a smoother filling process.
Environmental:
Low carbon – A key focus of the green transition is to decarbonise the construction sector, which globally creates around 35-40% of the worlds greenhouse gas emissions.
Boards such as plasterboard require natural gas during the manufacturing process.
Additional increases in CO2 emissions come from the mining of gypsum for inputs. As carbon prices increase, the comparative advantage of lower emissions building boards will likely grow. Also, building boards which utilise recycled gypsum will be lower carbon as they avoid the gypsum mining process. See Section 3 for further environmental information surrounding plasterboard.
Recyclable – As the emphasis on recycling increases, boards which are easily recyclable will likely avoid additional charges. Despite being theoretically simple to recycle, currently waste for plasterboard offcuts is estimated to be between 5-20% of total use, with surveys by the Building Research Establishment and Construction and Waste Resources Platform suggesting this figure may be as high as 30% (Greenspec).
Free from harmful additives – Some wooden building board products contain formaldehyde which is classified as a carcinogen in the UK and EU. Although endline consumers are likely unaffected by trace amounts of formaldehyde, on the production side the UK Health and Safety Executive does set maximum Workplace Exposure Limits (WELs) for formaldehyde (UK Health and Safety Executive).
Made from sustainable inputs – The inputs used to create the building board will affect the emissions of the board along every stage of its lifecycle. For example, using recycled material compared to mining may reduce emissions in the extraction phase. Boards with low emission inputs will likely become more price competitive as CO2 prices increase.
Building board types
This section will outline the features of the most common building boards and introduce a nascent low carbon board technology.
Plasterboard/Gypsum/Dry Wall:
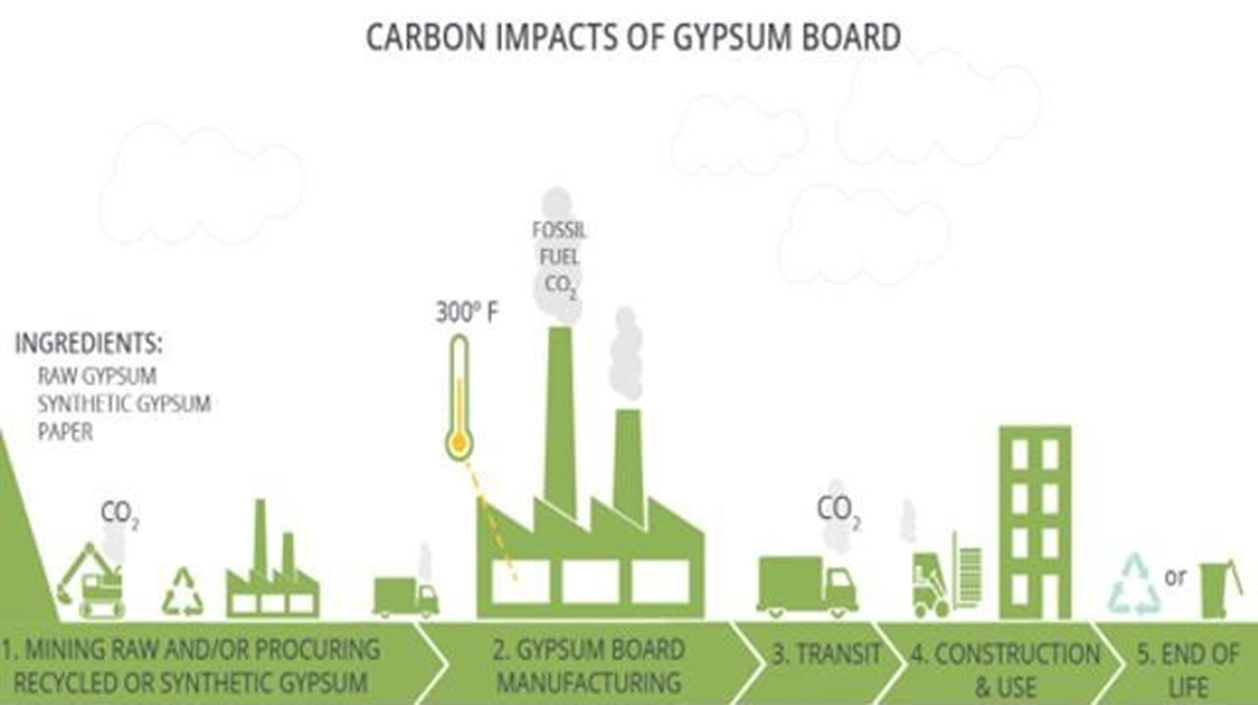
Plasterboard is currently the most widely used building board, with a core of gypsum plaster sandwiched between two layers of cardboard. Gypsum is sourced from a variety of processes, such as mining, synthetic production (gypsum is a by-product of ‘scrubbing’ in fossil fuel power stations) or from recycling old plasterboard. The gypsum is then crushed into powder, heated to remove excess water (calcining), mixed with water and other additives to form a slurry, spread between two layers of cardboard, then dried to produce a board.
Gypsum is a fairly abundant input, with standard plasterboard panels being low price. However, despite being theoretically recyclable, gypsum board is in practice rarely recycled. Additionally, screw retention in gypsum boards is low, meaning you cannot use traditional screws for most plasterboard.
Gypsum Fibre Board (GFB):
GFB adds cellulose fibres into the gypsum mix. Unlike plasterboard, which has a cardboard exterior, gypsum fibreboard is a homogenous product, so is solely the gypsum-cellulose mix throughout. This has implications on finish quality, as shown in Figure 3. GFB panels are typically higher cost than standard plasterboard, with poor finishing quality adding to the finished wall cost.
| Material Property | Gypsum Fibre Board | Gypsum Board | MDF Board | Wood Chip Board |
| Strength (1) | Medium | Low | High | Medium |
| Fire resistance | Class A (material) (2) Class 1 (covering) | Class A (material) (3) Class 1 (covering) | Class B (material) | Highly inflammable |
| Surface finish | Poor | Fair | Good | Good |
| Outdoor resistance | No | No | No | No |
| Machinability | Low | Low | High | High |
| Formaldehyde | No | No | Yes | Yes |
| Weight for thickness 12.5mm (kg/m2) | 14.4 | 9.5 | 9.6 | 8.2 |
1 – Strength covers impact resistance and withdrawal of screws
2 – Wall with one board on each side is fire resistant to 60 minutes in thickness of 12.5mm
3 – Two Gypsum boards are required to provide the same fire resistance as one EnviraBoard or Gypsum Fibre Board
Medium density fibreboard (MDF):
MDF is an engineered wood product where wood fibres are combined with a binder (typically resin), then compressed into dense uniform panels. Often used as a cheaper alternative to plywood, it has a wide range of applications such as carpentry and interior wood panelling. The wood fibres are often sourced from waste wood or sawdust, however whether this can be viewed as a sustainable input is contentious. For example if this waste wood comes from untouched forest, then this is likely not sustainable. Additionally the resin binder used to glue the wood fibres together makes recycling complex, with historical recycling rates near zero (Zimmer & Bachman, 2023).
Wood Chip:
Wood chip board, also known as particleboard, is similar to MDF in that it is an engineered wood product. Wood chips, sawdust and shavings are bonded together with a resin binder, then compressed into panels. These panels are lower density than MDF, with wood chip being lower strength and highly flammable. Although the characteristics of wood chip and MDF and different, environmental issues such as where the wood is sourced from and recycling issues are similar for both.
New – Recycled Paper Waste:
Lower emission building board technology uses waste from the paper recycling process as an input into the building board. This use of secondary waste replaces the need for the paper sludge to be disposed of, thus reducing waste disposal costs and associated emissions. This sludge is mixed with dry gypsum and water, compressed into boards, hardened and dried, then finished with layers of paper. Similar to standard plasterboard, the process of converting slurry to a hardened product is energy intensive, however the use of secondary waste is a key innovation in regard to reducing the carbon footprint of the building board. The use of waste makes it theoretically possible that these boards can be carbon-negative. This would be the case when the energy required for manufacture is less than the energy saved by omitting the disposal process. This technology is considered in detail in Section 4, which considers the markets associated with boards from secondary paper sludge waste, and EnviraBoard, an innovative alternative to plasterboard, as a case study.
Section 2: Building Board Demand
Global Demand
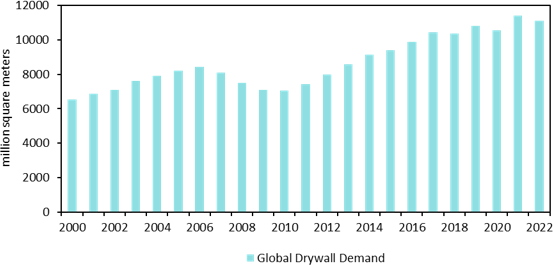
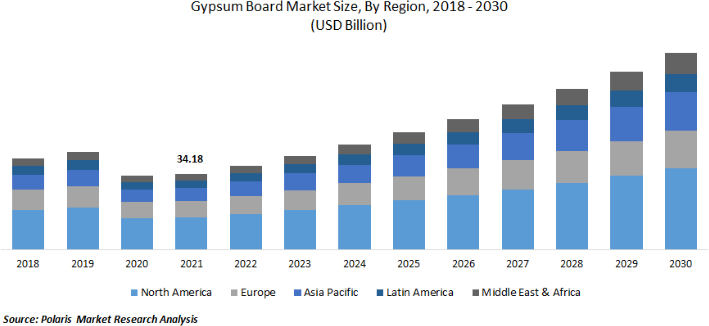
Globally demand for plasterboard was estimated at 11.2 billion square metres in 2022 as shown in Figure 4. This corresponds to a market value of $23.2 billion, however market value and growth estimates vary significantly by source. For example Grandview Research estimated gypsum board market size was 14.7 billion square metres in 2022. CAGR estimates range from 12.7% (Grandview Research), to 5% (Mordor Intelligence), while others predict annual growth as low as 1.8% (Freedonia). Between 2024 to 2031, one CAGR estimate for global building board growth is 12.1% (Bestion Research).
The main reason these sources differ is due to their European and Middle East & Africa (MEA) market growth predictions. Grandview consider the MEA market to be the fastest growing market, while the other sources do not view MEA as a significant driver of demand. Freedonia is the most pessimistic and considers the European market to be limited by lower residential construction in Western Europe.
Further detail for UK, US and EU markets will be included within this section.
Building board demand depends primarily on the construction industry
Unsurprisingly the demand for building board is determined by the trends in the construction industry. Historically construction has been regarded as quite cyclical, with the NYU Stern Business School highlighting the
Engineering/ Construction industry has a Beta = 0.84. This means public companies in construction/engineering share price tend to move by slightly less than one-to-one with the market as a whole.
Additionally construction is also highly sensitive to interest rate changes due to its reliance on debt financing on both the demand and the supply side. From Figure 4 we can see how demand for plasterboard is also volatile, with a reduction in demand (in levels) between 2006 and 2010, as well as a contraction in 2020 due to the pandemic.
Current applications of plasterboard
Figure 5 illustrates the current applications of plasterboard with the residential use the most common (precise numbers are hidden behind a paywall) . In regard to which countries utilise plasterboard most often, statistics disaggregated by country are difficult to find due to being behind paywalls, however typically urbanised, wealthier countries use more plasterboard.
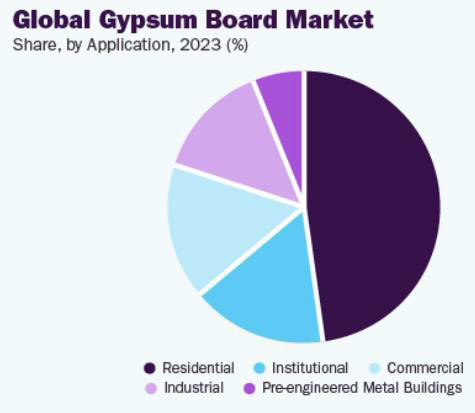
The North American and European markets for plasterboard have grown significantly since the mid 20th century and have historically been considered the most lucrative market. In 2023, the US is estimated to have accounted for 29% of global market share (Fact.MR), however these market share sources can be misleading due to price differences between countries meaning poor countries may use high quantities of board but have lower market shares due to their board prices being lower.
International Trade
International trade is somewhat limited for plasterboard due to (Freedonia):
- High transportation costs relative to product value
- Fairly abundant within-country supply of gypsum (mined, synthetic, recycled)
- The need for quick transport from factory or warehouse to construction site
Figure 6 (overleaf) highlights the largest exporters and importers of plasterboard. Germany, China and the US dominate exports, with Switzerland, Canada and France the largest importers.
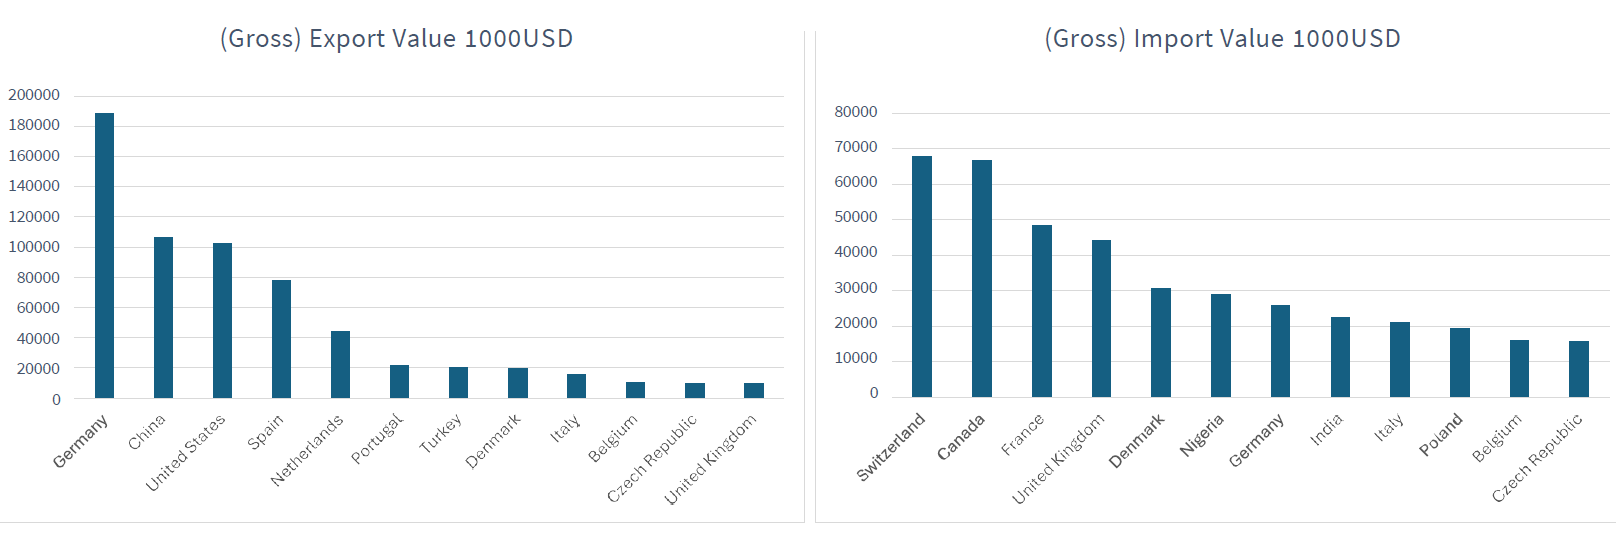
It is worth noting that although high levels of exports are indicative of significant manufacturing capacity, exports do not entirely reflect manufacturing capacity as they do not account for the domestic market. For instance the US and China produce far more plasterboard than Germany, but much of this is used domestically.
Factors influencing demand
The most relevant factors for building board demand vary significantly by country due to economic, cultural, political and environmental differences. This means that countries will have different preferences over how widely building boards should be used, as well as the type of building board used.
Looking first at (sometimes overlapping) factors which determine unit sales of building boards across countries:
Urbanisation and ease of residential construction – Urbanisation and new residential construction are significant drivers of building board demand in upper- and middle-income countries. The most striking example of this is the Chinese market, with Chinese demand for gypsum board growth rate forecast at more than 8% CAGR (Bonafide Research). Note, in lower income countries, plasterboard tends to be more prevalent in non-residential buildings than residential due to non-residential buildings often being built by multinational contractors using modern construction methods. Freedonia highlights that stagnant housing construction will limit growth in residential demand for plasterboard in Europe.
Economic growth – Economic growth typically boosts construction activity, increasing residential, commercial and industrial construction.
Existing building stock quality – Retrofitting and improving existing structures, for instance to increase insulation, is a significant driver of plasterboard demand. For non-residential construction, Freedonia estimates around 40% of plasterboard demand came from ‘Improvements and Repairs’ which is significant. Going forward, this factor is likely particularly relevant in developed countries. Storm activity – In coastal regions, storm activity damages buildings, with the repairs leading to increased building board demand. Freedonia highlights this is a material factor for US plasterboard demand, so it is plausible that storm activity affects demand in other coastal regions across the globe.
Storm activity – In coastal regions, storm activity damages buildings, with the repairs leading to increased building board demand. Freedonia highlights this is a material factor for US plasterboard demand, so it is plausible that storm activity affects demand in other coastal regions across the globe.
Government policy – Building regulations mandate the characteristics new buildings must possess. Regulations in wealthier countries often favour the use of plasterboard due to its functional and financial advantages. As poorer countries develop, it is likely that building regulations will become more stringent in regard to fire safety and building quality, thus it is not unlikely that plasterboard demand will increase (as evidenced APAC’s recent growth)
Looking at factors which determine the type of building board used:
Cost – Most obviously the cost of a building board will affect its attractiveness to users. Although the panel cost is important, the ultimate consideration is the cost per unit of finished wall. This means that boards which are slightly more expensive to produce may still be price competitive if they are easy to shape, install, and finish. Additionally, boards which possess improved fire resistance or sound absorption may generate cost saving directly and indirectly. Directly, if one alternative board has the fire resistance of two standard gypsum boards, this will clearly reduce costs. Indirectly, this saved space will increase the interior space of the building, thus increasing the effective size of the property.
Direct environmental policy – Western European governments in particular are eager to reduce construction emissions and waste. Direct policies to reduce emissions and waste while still meeting building regulations may involve the use of novel building boards, or a change in how plasterboard is currently manufactured and disposed of. Construction has been one focus of the EU “circular economy” , replacing the current, mostly linear, production process. Therefore polices penalising waste (such as disposal charges), or emissions intensive input procurement (such as mining) may increase the endline plasterboard price, incentivising the uptake of less traditional, more environmentally friendly, building boards. This may improve the comparative advantage of boards such as gypsum fibre or boards from secondary paper sludge waste.
Indirect environmental policy – Non construction specific policy, for instance a general carbon price, will increase the price of carbon intensive building materials. This will clearly improve the comparative advantage of lower carbon building boards.
Climate – Humid climates require specific types of moisture-resistant building boards.
Building regulations – Building regulations may further their emphasis on environmentally friendly construction, perhaps mandating widely recyclable low emissions building boards provided they meet safety standards. This may lead to a gradual phase-out of plasterboard if an environmentally superior alternative can penetrate the market.
Key regional markets
We end this section with some statistics on key regional plasterboard markets. Unfortunately, high-quality data comparing the markets is often hidden behind paywalls, so the selection of statistics is somewhat idiosyncratic.
UK Market
The UK exported 9.5 million USD and imported 44.2 million USD of plasterboard in 2023 (World Integrated Trade Solution). The UK produced 3 billion square feet (278million square metres) of plasterboard in 2022 (Morsali et al, 2024).
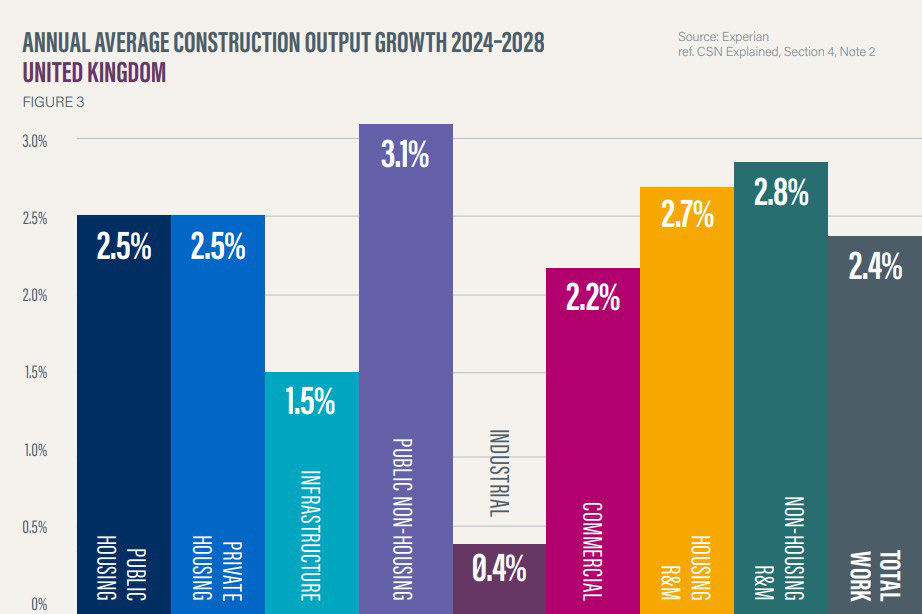
Construction output is forecast to increase at an average growth rate of 2.4% (CAGR = 2.3%) between 2024 – 2028 (CITB). As shown in the figure below, the largest increases are in non- residential public housing (eg schools), and repairs and maintenance. These are sectors where the plasterboard is typically utilised. Perhaps it is not implausible that public housing construction will have a stronger preference for environmentally construction than private sector construction.
KBV Research estimates a UK CAGR of 8.4% between 2023 to 2030 for gypsum boards. They argue a higher CAGR is justified due to plasterboards increasing importance in meeting building regulations. However, this source is predicting much higher CAGRs than other research reports.
ReportLinker highlights that there will be increasing demand for gypsum board in the UK due to its cost effectiveness and ease of installation. These desirable features are not exclusive to plasterboard,
Plasterboard manufacture in the UK uses around 3 million tonnes of gypsum, with this representing 60% of the UK’s gypsum use (Greenspec)
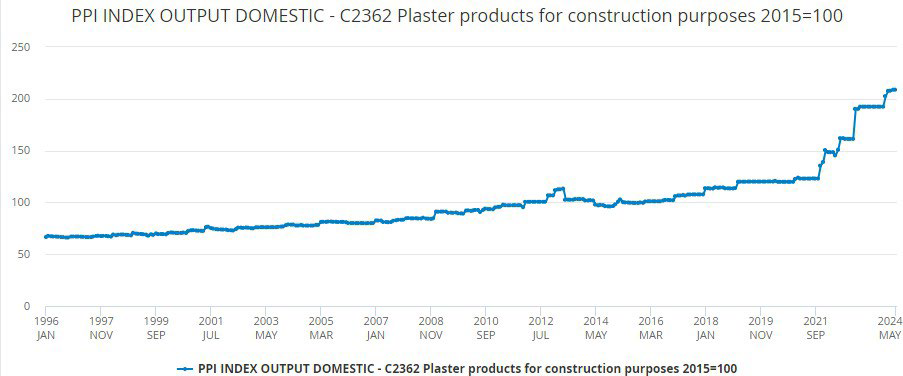
Prices – UK plaster products (including boards, sheets, panels) have significantly increased in price since 2021 as shown in Figure 9. We can see on this Figure that prices grew at a slow, fairly constant rate between 1996 and 2021.
This is in line with price inflation for other construction materials. This sudden increase in price is a mixture of supply chain disruptions (Covid-19 pandemic, skill shortages, spikes in energy costs, planning constraints) and demand-side shocks (pent-up demand during the pandemic).
European Market
Construction generates around 9% of GDP in the EU (Single Market Economy), with the EU imposing Eurocodes to specify structural design. These Eurocodes are standard technical specifications for all public works contracts in the EU member states and favour the use of plasterboard due to its fire resistance and soundproofing qualities. Western Europe construction is projected to grow at (CAGR) of 1.4% from 2023 to 2027 (GlobalData). Eastern Europe construction is forecast to grow at a CAGR of 3.6% from 2024 to 2028. (Yahoo Finance)
CAGR estimates:
- Plasterboard demand forecast to grow at CAGR 6.5% from 2022 to 2028 fuelled by the increasing use of plasterboard panels in modern buildings (Business Market Insights).
- Morder Intelligence forecasts a CAGR of greater than 5% between 2024 to 2029 for gypsum boards, primarily driven by its increasing application in the residential sector.
- KBVResearch forecasts a CAGR of 9.3% between 2023 – 2030 for gypsum board demand. They justify this relatively higher CAGR by emphasising building boards contribution to meeting building regulation.
EU gypsum market valued at $464.7 million in 2020 and is projected to reach $680.5 by 2028. This increase is in line with increased construction and renovation activities across the region (ReportLinker).
Prices – Producer prices of plaster products have risen significantly across the EU since 2021 (base year = June 2021), with a small decrease in price since June 2023 (Trading Economics) as shown in Figure 10.
US Market
US produced 28 billion square feet ( in 2022 of plasterboard (Morsali et al, 2024). US gypsum market size is projected to be $3.53 billion by 2029, with an anticipated growth rate (CAGR) of 4.6% from 2023 to 2029 (ReportLinker).
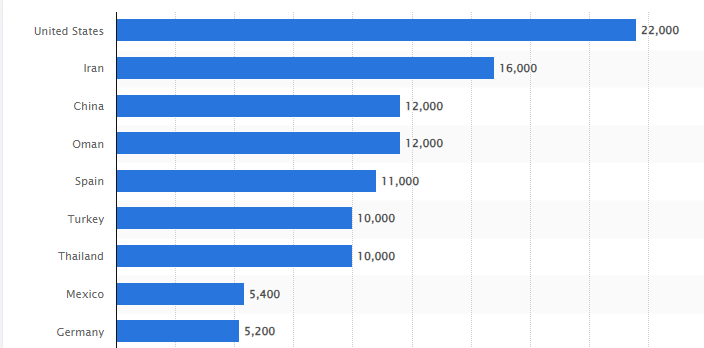
US produced the most mined gypsum of any country in 2023, producing 22 million metric tons of mined gypsum (Statista). Note, gypsum can also be produced synthetically or by recycling. US is estimated to have accounted for 29% of global market share of current plasterboard demand (Fact.MR)
A typical new American home contains more than 7 metric tons of gypsum, mostly used in plasterboard (US National Minerals Information Center).
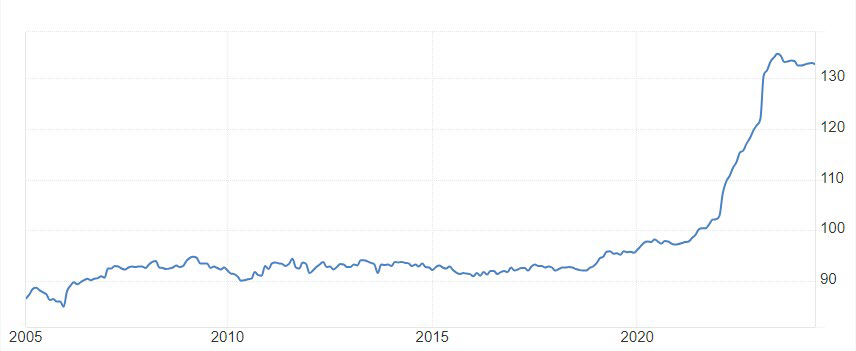
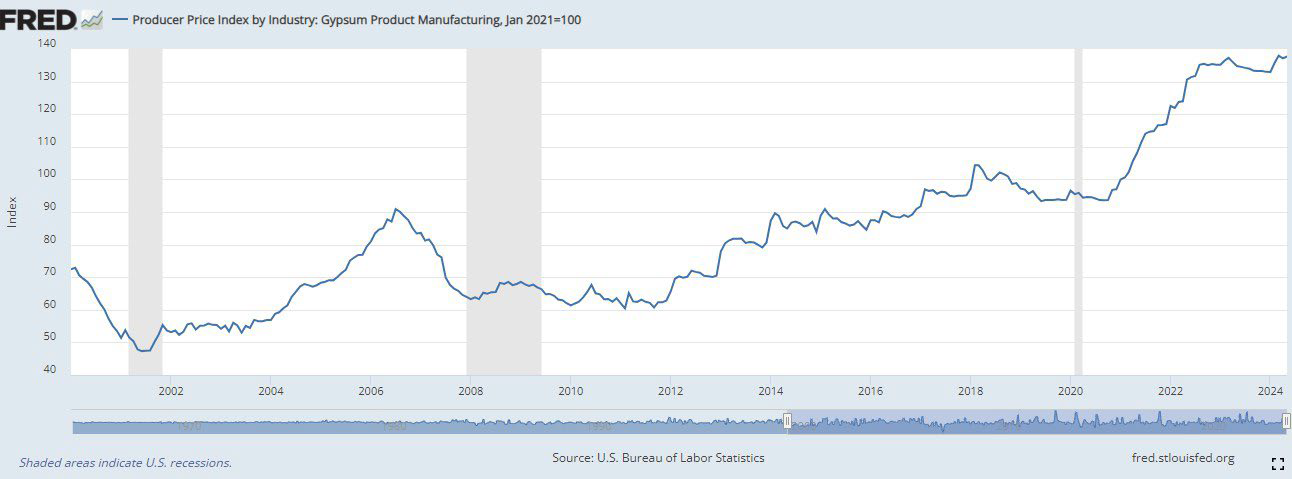
Prices – Producer prices of gypsum product manufacturing (including plasterboard) in the US increased steeply in 2021 (2021 = base year so index = 100). (Federal Reserve)
Similar to the EU, prices have flattened since 2023.
Section 3: Net Zero Building Boards
Current plasterboard environmental impact
This section considers the greenhouse gas emissions associated with building boards and the strategies by which these could potentially be eliminated. As plasterboard represents the vast majority of building board use, we highlight some environmental problems associated with plasterboard throughout its lifecycle.
Plasterboard’s environmental impact is difficult to precisely quantify, with the overall carbon footprint varying chiefly with the type of gypsum used (mined, synthetic, recycled), manufacturing process, transit distances and end of life practices (landfill or recycling).
Despite being relatively low carbon compared to other building inputs such as concrete, it is important to consider the carbon footprint of plasterboard given its global utilisation.
UK plasterboard life cycle assessment found that the life cycle of 1 metre squared of plasterboard (thickness of 12.55mm) resulted in the production of 2.14kg of CO2 equivalent (Morsali et al, 2024).
A back-of-the-envelope calculation multiplying this emissions factor (2.14kg per metre squared) by UK plasterboard production (278.7 million metres squared) yields a carbon footprint of roughly 594 million kg of CO2 equivalent, or 594,000 metric tons of CO2 equivalent in 2022.
At a carbon price of £30 per tonne (a low baseline), this equates to a £17.9 million pound carbon cost in 2022. Note, this does not include imported boards, so is an underestimate of total emissions associated with UK use.
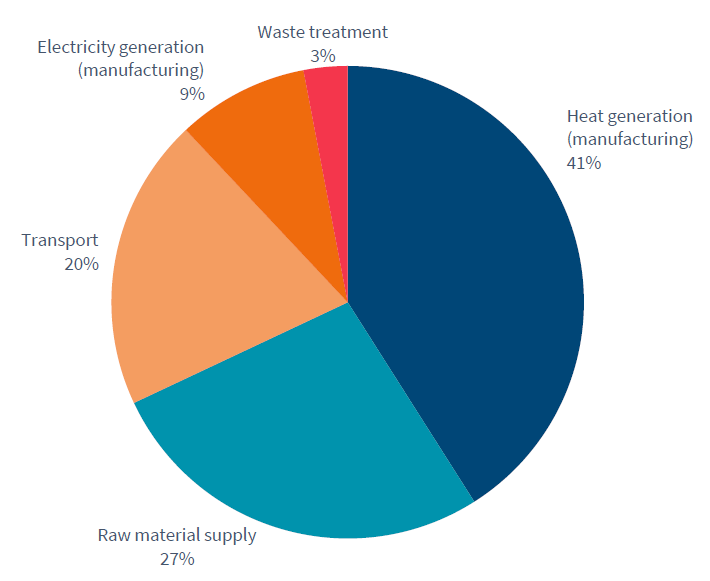
As shown in Figure 14, (Morsali et al, 2024) estimate that, for UK plasterboard, the manufacturing process is the most emitting, responsible for 50% of total emissions (heat generation plus electricity generation). The raw material supply is responsible for 27% of CO2 emissions, transportation 20% and waste treatment 3%. Note, the installation and use phase of building boards has a negligible carbon footprint due to the ease of installation and lack of required maintenance.
Given these statistics, we identify potential methods to reduce building board emissions, both directly and indirectly. There are third important caveats to our analysis:
- Plasterboard emissions are intricately linked to emissions in other sectors, such as electricity and heat generation, mining or transport. This means that innovation in other sectors may positively spillover into the plasterboard production process, reducing its carbon footprint.
- The environmental impacts of plasterboard production are not contained to carbon emissions, with water consumption, ozone depletion and fine particulate matter production other factors considered in a thorough life cycle analysis. Morsali et al 2024 highlight the raw material supply is the most significant contributor to many of these wider factors, however this report focuses on CO2 emissions.
- These statistics are for the UK so the emissions factor used is UK specific. Although we expect the manufacturing process in European countries to be similar, there may be some variation in emissions depending on how the gypsum is sourced and transportation distances/methods.
Reducing building board emissions
We consider factors which could reduce carbon footprint of the building board industry.
Lower emission inputs – Given the substantial contribution to emissions, building board products with low emissions inputs represent an important environmental improvement. Within plasterboard, alternatives to mined gypsum are synthetic gypsum or recycled gypsum. Synthetic gypsum is primarily created through scrubbing gas captured within emission control systems at coal fired electric utilities.
Although harvesting the synthetic gypsum itself is not environmentally damaging and synthetic gypsum does represent waste being converted into an economically useful input, the wider system of coal power generation is problematic.
The use of recycled gypsum is more desirable, where gypsum is derived from used plasterboard. This is closer to the idea of a circular economy, where products at the end of their useful life are used as inputs for new products. In theory, gypsum is indefinitely recyclable however recycling rates of plasterboard are low. Although slightly dated, a 2020 construction article highlights that only 5% of production waste (boards that do not meet specifications) was recycled, 7% of gypsum construction waste was recycled, and 1% of demolition waste was recycled. Therefore although recycled gypsum may have the theoretical capability to reduce the carbon footprint of plasterboard, in practice this seems unlikely. Another challenge is that when wet plasterboard can break down producing hydrogen sulphide, a toxic gas.
Alternative boards, such as MDF or wood chip, avoid issues associated with gypsum supply. However, alongside mainly inferior key product characteristics (for instance worse fire resistance), their environmental input credentials are dubious as they depend on the type of wood they derive from.
Negative Emission Input – Waste sludge from paper recycling
Lower emission inputs are a key area where building boards derived from waste material have a clear competitive advantage. In general, the use of waste as an input will typically be carbon-negative within the input stage (ie not considering manufacturing or transportation), as the alternative to using the waste is to dispose of it – releasing its carbon. One example is board from secondary paper sludge waste discussed in Section 2, where the waste sludge from paper recycling contains carbon and this carbon is bound within the building boards, rather than being released into the atmosphere during disposal. This represents a two-fold reduction in emissions, firstly with the carbon from the waste sludge being contained, secondly avoiding an alternative board (for instance plasterboard) having to be produced.
Manufacturing process – Manufacturing plasterboard or board from secondary paper sludge waste requires heat generation to dry and harden paste. This step is likely harder to substitute from in the short term than the input substitution described above. This process is similarly polluting for gypsum boards and boards from secondary paper sludge waste.
Transportation – All else equal, lighter boards are associated with lower transportation emissions. However higher emissions from transporting heavier boards may be offset if the use of heavier boards results in fewer total boards being used, thus lowering effective total transportation distances.
Reuse and Recycling – Boards which can be easily recycled and reused will reduce the quantity of new inputs required. Wooden boards are more difficult to recycle due to the binder, while plasterboard can become hazardous when wet and current recycling rates are low.
Quality of finish – Boards with a higher quality finish require less labour and materials upon wall completion (see section 2 for an explanation on board finish). This represents a reduction in cost for the contractor, as well as a reduction in associated emissions. Additionally, boards which require fewer overlaying materials are typically easier to recycle as the process of recovering the original board is less complex.
Use fewer – Most obviously, if the number of building boards required in a project is lower, all else equal, emissions will be lower. Typically the quantity of boards in use is such that building regulations relating to fire resistance and sound absorption are satisfied. This means that significant emissions reductions may be achievable by improvements in key building board characteristics, allowing fewer boards to be used.
One example of such innovation would be boards from secondary paper sludge waste possessing superior fire resistance relative to standard gypsum board. More specifically, this allows one board from secondary paper sludge waste to be used to achieve the fire resistance of two gypsum boards, representing a clear opportunity for emissions reduction.
Given boards from secondary paper sludge waste are also much lower emissions than plasterboard (they are carbon- negative over the input and manufacture stages), then the scope for emission reduction is even larger.
Section 4: Boards from secondary paper sludge waste
Paper recycling markets
The final section considers boards from secondary paper sludge waste, a potential environmentally friendly alternative to standard plasterboard. We explore the existing markets for recycled paper waste then highlight a specific building board, EnviraBoard, in a case study.
As the use of recycled paper waste is the key innovation for these alternative building boards, it is important to consider the factors which affect the supply and price of this input.
Of the paper that recycling facilities process, around 70% of the initial paper weight can be recovered as recycled paper, with the remaining 30% a secondary sludge waste. This sludge waste contains significant amounts of carbon such as wood fibres. Additionally, this sludge waste has no other commercial use so firms must dispose of it, typically incurring disposal charges. These charges vary across country, with disposal charges across the EU ranging from around EUR 10-20 up to above EUR 100 per tonne. Countries such as Denmark have high disposal fees at around EUR 130 per tonne.
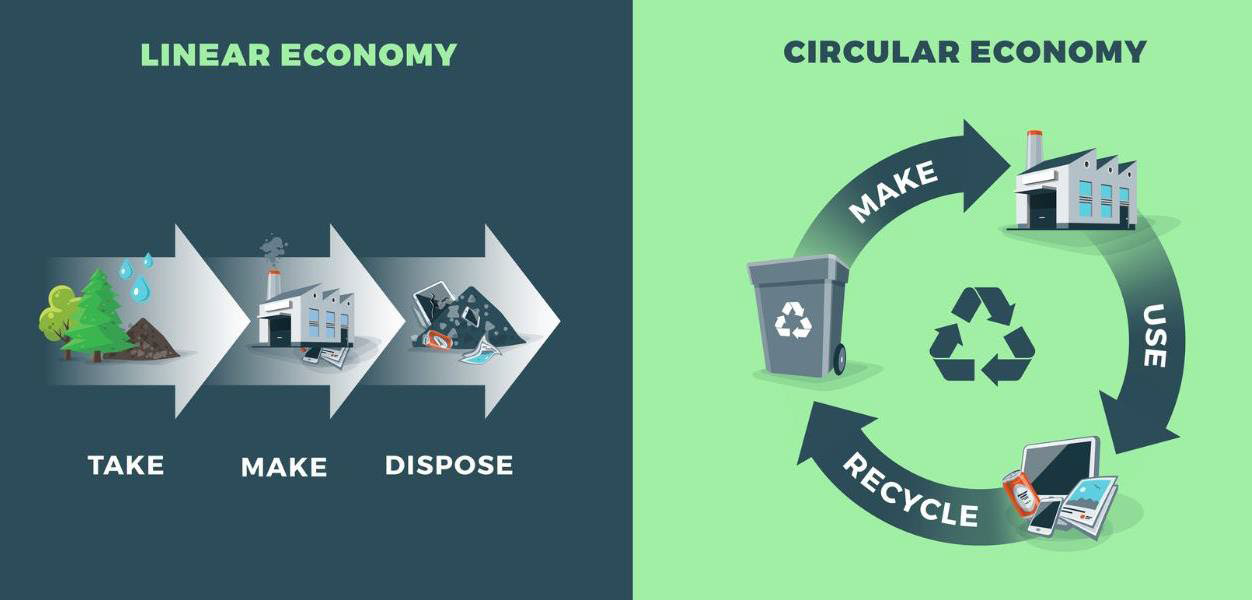
These fundamentals suggest there would be substantial benefits from transactions between waste producing recycling facilities and building board manufacturers, both financially and environmentally. Financially, recycled paper mills can avoid the disposal charges while board manufacturers source a cheap input. Environmental gains stem from the fact that the carbon content of the waste is bound within the boards and that the production of these carbon-negative boards can replace higher carbon footprint boards. This is a striking feature of boards from secondary paper sludge waste.
It is important to highlight that trade in recycled paper waste sludge is less financially viable over large distances due to the products very low value to weight ratio. Additionally, long transportation distances will increase the total carbon footprint of the final product. Therefore feasible markets for recycled paper waste likely only exist in nearby countries which have paper recycling facilities.
Key supply metrics
The two key determinants for the availability of recycled paper waste for a given country are:
- Magnitude of paper consumption ( the level of paper which could be recycled)
- Recycling rates (the fraction of the produced paper that is recycled)
Together these are suggestive of recycled paper waste levels, where clearly these levels are higher in countries which use lots of paper and then recycle it. We present some current statistics on these metrics and highlight potential future trends.
Paper Use
The future direction of paper use is a little uncertain, with significant heterogeneity by country and paper type. Paper production is sensitive to the macroeconomy, with an beta of 1.51 for US Paper/Forest Product companies (NYU). This means the paper industry is more sensitive to the market then the construction industry, which is perhaps surprising.
One example of this sensitivity is that European paper production fell by 12.8% in 2023 due to rising energy costs and wider macroeconomic slowdowns, according to the CEPI (Confederation of European Paper Industries),
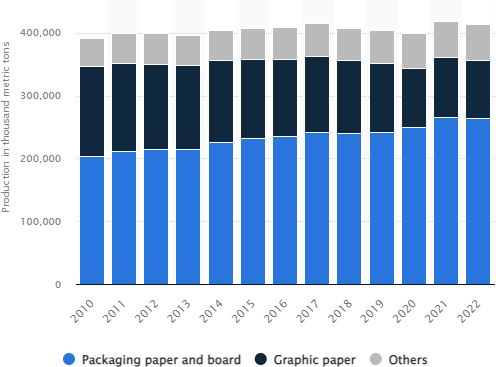
Trends such as digitalisation are expected to shrink the demand for graphic paper, with this sector already contracting, as shown in Figure 15 and 16 (Statista). This contraction is compounded by a significant reduction in printing in offices, other business purposes and at schools and universities.
However overall paper and paperboard consumption is forecast to continue increase at a CAGR of 1.4% between 2023 to 2032 (Statista). There are several factors which contribute to this increase in demand such as economic development in APAC and the growth of e- commerce leading to growth in packaging paper.
Recycled newspapers and glossy magazines are preferred for the boards from secondary paper sludge waste, and although its global production has decreased, the absolute level of production in 2022 was 91.3 million metric tonnes, which is still sizable. Furthermore, some estimate the global graphic paper market size to record a CAGR of 5.3% from 2023 to 2032, driven by increased demand for e-commerce and substitution away from plastic to paper packaging (Custom Market Insights). Paper consumption varies significantly, with the global average consumption of 55kg/person (Haile et al, 2021) masking significant variability. For instance, this number is only 7kg/person in Africa while is 215kg/person in North America and 125kg/person in Europe.
Paper production is dominated by China and the US, with Japan and Germany the next largest producers. Europe produces around a quarter of the world’s paper and paperboard supply (approximately 100 million tonnes) (Statista), with Germany the largest exporter of paper and paperboard in 2022 (Statista).
In terms of the number of paper and pulp mills across regions:
- In 2022 there were 720 in Europe (Statista). Of which around a quarter have paper recycling facilities. (source is the business plan)
- There are around 450 paper mills in the US (NCASI), with around 80% of US mills using recycled paper (American Forest & Paper Association). Approximately 140 use recovered paper exclusively (source = business plan)
- There are 47 paper mills in the UK, producing 4 million tonnes of product (CPI)
Recycling Rates
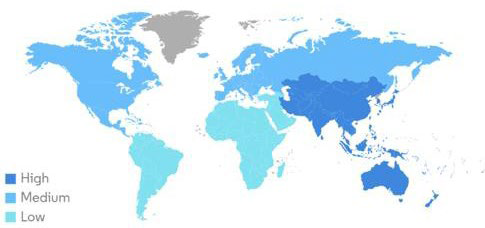
While paper use growth rates may be low, increasing recycling rates will offset some, or potentially even all, of the fall in paper production. We present statistics on paper recycling rates across regions, with local recycling rates important given the high transportation costs of paper sludge waste relative to its value.
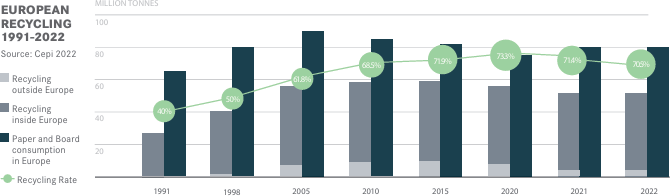
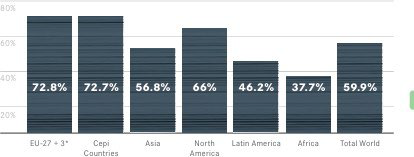
Europe – In 2022 70.5% of all paper and board consumed in Europe was recycled, with a declaration to reach 76% by 2030 in place. As shown in the Figure below this recycling rate is lower than the 2015 rate, although this is mainly driven by a decrease in recycling outside of Europe (the light grey shaded area). Paper fibres in the
EU are used 3.5 times on average, compared to a global average of 2.5, with paper being the most recycled packaging material in Europe (Monitoring Report 2022).
It is more sensible to focus on domestic recycling as this will yeild paper sludge waste within Europe. The domestic recycling rate was 63.1% in 2022 and has remained relatively constant throughout the past seven years. This 2022 recycling rate may be negatively biased by particularly high electricity and gas prices, with mills consuming recycled paper being more dependent on gas supply for their energy consumptions compared to mills using virgin fibres (Monitoring Report 2022). Arguably, if we could strip out the variation in recycling rates due to energy shocks, (with energy prices since falling), then the 2022 recycling rate would be larger, with the Conferation of European Paper Industry highlighting that these recycled paper mills decreased their capacity utilistation in 2022, despite investment in 2021 to increase recycling capacity.
United States – The US paper recycling rate was 67.9% with the cardboard recycling rate at 93% in 2022 (AF&PA). The American Forest and Paper Association (AF&PA) own more than 100 paper materials recovery facilities nationwide, with the paper recycling rate having more than doubled since 1990. According to the AF&PA, the US paper industry has announced close to $7 billion in plant investment that will use more than 9 million tons (8.16 million metrics tonnes) of recovered fibre (AF&PA).
Broader picture – Recycling rates vary significantly across the globe as shown in Figure 18, with European and North American countries achieving the largest rates globally.
Particularly in these regions, it seems unlikely that the raw materials for boards from secondary paper sludge waste will become scarce, with high recycling rates partially offsetting decreases in graphic paper use.
If we believe government policy will continue to support a transition towards a circular economy, then increasing waste disposal charges, or carbon prices, will make boards from secondary paper sludge waste more profitable.
Additionally, in the short term, normalising energy costs should bolter recycling rates.
EnviraBoard – Case study
We conclude this section and report by focussing in on a specific recycled paper waste building board, EnviraBoard. This board has established production on two earlier occasions, with the building board now on its third technological generation. The board has achieved ETA approval and CE marking (see Section 1 – Desirable Building Board Qualities) for fire resistance and sound proofing, with full scale production expected to commence shortly. It is important to highlight that these approvals and certifications were obtained on the boards from an earlier production in Denmark. To comply with EU regulation on sale of building materials, any boards from a newly established production facility must be taken through the required tests and verifications to obtain these approvals and certifications. All such approvals and certification are always and only granted to the specific production site.
Circular Economy
The key innovation in these boards is the use of secondary waste as a raw material.
As highlighted in Section 3, plasterboard inputs constitute a significant share, 27%, of the overall global warming potential. This gives EnviraBoard a clear competitive advantage given its own inputs are carbon-negative.
The use of secondary waste as an input is in line with the concept of the circular economy, with the use of recycled gypsum also consistent. At the end of EnviraBoard’s life the boards are fully recyclable. This means that at no stage is the board sourcing unsustainable raw materials, nor is the production of the board adding to the existing stock of carbon emissions.
EnviraBoard seems well placed to meet EU legislation penalising waste and encouraging sustainable building practices.
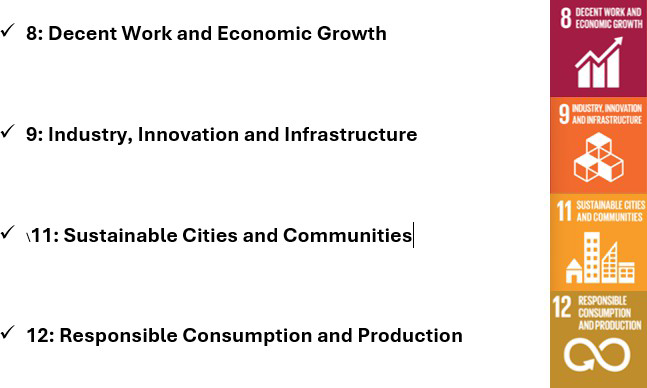
Additionally, EnviraBoard is aligned with the UN Sustainable Development Goals 8,9,11 and 12.
Qualities of EnviraBoard
As per Section 1, we separate the EnviraBoard qualities into the, occasionally overlapping, functional, financial and environmental categories. Where relevant we compare to plasterboard.
Functional
Screw retention – EnviraBoard has a screw retention of 30-40 kilograms which is unusually high for building boards. This is superior to plasterboard which has a much lower screw retention and is not intended to be bear weight.
Strength – EnviraBoard is denser than alternative building boards, with significantly improved impact absorption and screw withdrawal relative to plasterboard.
Fire resistance – ETA approved and CE marked for fire resistance. It is Class A as a material and Class 1 as a covering, meaning that a wall with one board on each side is fire resistant for 60 minutes (for a board thickness of 12.5mm). One EnviraBoard offers the same fire protection as two standard gypsum boards
Sound absorption – ETA approved and CE marked for sound absorption.
High machinability – EnviraBoard is denser than plasterboard and breaks much less easily. EnviraBoard can be sawn, cut or planed straightforwardly.
Weight – A square metre of 12.5mm thick EnviraBoard board weighs 15.6kg compared to around 9.5kg for gypsum boards.
Outdoor resistance – EnviraBoard is not designed to be used outdoors due to exposure to moisture. This is the case for almost all standard building boards.
Flexibility – the board can bend, with radius 2000mm for a standard, 12.5mm thick, board. This is a functional advantage as the building board can then be used to fit slightly curved , or less standardly shaped, walls.
Customisability – A range of widths (50mm to 1200mm), lengths (50mm to 3000mm) and thicknesses (8mm to 22mm) can be offered. In regard to edges, any angle or round can be offered to customers. This means EnviraBoard can be used for a wider range of wall specifications.
Financial
Board cost – The board cost is slightly greater than that of standard plasterboard, however this is offset by its key qualities listed below. For reference, in the UK, good quality plasterboard retails for around £3.50/m2 (excluding VAT). Gypsum fibre board is more expensive at around £9.25/m2 (excluding VAT). These figures are for board with thickness 12.5mm
Improved fire resistance allows for fewer boards – This means contractors can use fewer boards to meet fire safety requirements and the reduced width of the building board increases the effective floorspace of the room.
Ease of finishing – EnviraBoard has a very high-quality finish which reduces the cost for contractors when creating a smooth surface over the building board. When accounting for these costs, the cost per finished square metre of EnviraBoard is expected to be price competitive with plasterboard. As emphasised in Section 1, this cost per finished square metre is the ultimate consideration of a contractor.
Unlike EnviraBoard, Plasterboard requires a primer to be applied before painting, adding to the cost and duration of construction.
Ease of installation – Due to the high machinability, finish quality and ease of filling, installation of EnviraBoard is straightforward for the contractor.
Ease of filling – EnviraBoard has a unique edge design on the boards to make the filler job simpler. Filler is only required over the two connecting edges of boards and only needs to be applied two times.
Tailormade supply during construction reduces waste – EnviraBoard will be delivered in customised sizes, at the correct quantities, just-in-time at the construction site. This will significantly reduce waste, (with Section 1 highlighting plasterboard waste was up to 20% of total use) with cut-off waste at the production plant being fully recyclable.
Environmental
Carbon-negative – The carbon content in the secondary paper sludge waste is greater than the CO2 generated from board production. Thus the input to product stage is carbon-negative. At EUR 50.65 per tonne of CO2, the lowest price in 2024 (European Union Allowance), this suggests financial gains are possible simply from carbon trading. The use of energy typically generates CO2 emissions however the quantity of emissions produced is less than emissions equivalent in the sludge waste.
Additionally, as clean energy (such as renewables) and cleaner combustible fuel (such as hydrogen) become more prevalent, the emissions associated with production are likely to fall.
Sustainable inputs – The inputs for EnviraBoard are recycled gypsum, paper sludge waste and energy. Recycled gypsum avoids the mining process, with secondary paper sludge waste a plentiful resource as highlighted earlier this section.
Fully recyclable – EnviraBoard is fully recyclable, although similar to plasterboard there may be issues with recycling rates in practice as highlighted in Section 1.
Free of harmful chemicals– 99% of the organic matter is destroyed during manufacturing, with EnviraBoard not containing potentially harmful substances such as lead, chlorides or formaldehyde. This means workers are not exposed to hazardous substances during production.
Economics
EnviraBoard operates in two markets, the downstream market for the board itself and the upstream market for the production plants.
Board – Downstream
Section 2 highlighted that building board demand is forecast to increase in Europe and North America, with particularly strong growth in APAC. These increases were due to a variety of factors, such as urbanisation, a shift away from traditional interior wall methods, increased focus on fire safety in building regulations and the increasing awareness around sustainable construction. The emphasis on fire safety and sustainable construction techniques in high income countries favours EnviraBoard, particularly given trends in waste disposal charges.
At the board level, EnviraBoard is more expensive than standard plasterboard per unfinished metre squared, however EnviraBoard is price competitive when considering the cost per finished metre squared of wall, which is the ultimate determinant for a contractor.
The growth of the building board market along with the price competitiveness of EnviraBoard suggests there will sufficient demand for the board.
Production Plants – Upstream
Section 4 highlights that the production plants utilise secondary paper sludge waste as a raw material and that this waste is a fairly plentiful input. The use of this waste avoids a disposal cost, while creating boards which generate revenue.
This makes production plants attractive for firms generating recycled paper waste. Clearly the upstream and downstream markets are linked, with favourable board sales causing the production plants to be more attractive.
Competitors
The key players in the market are typically large, established companies with European- wide distribution.
There are the newer gypsum fibre building boards as well as existing building board producers, who produce more standard products at scale.
Additional information on the competitive landscape is available.
Case study summary
To summarise this case study: EnviraBoard is a carbon-negative, sustainable building board which has several quality advantages over standard plasterboard. The potential limiting factor is the relatively higher board cost, although this is offset by the finish quality. The building board market is vast, so even a small market share would correspond to substantial revenues. Structurally, EnviraBoard has advantages in terms of the transition towards lower carbon construction, although it should be noted the speed of this transition is unpredictable and vulnerable to political events.
The super-short report summary
Construction is crucial for providing homes, offices, factories and many more structures, however it has a substantial carbon footprint. This harm can be reduced by the use of environmentally friendly, low carbon building inputs, with EnviraBoard an example of a carbon-negative input while actually increasing 9/10 key quality performance metrics. The use of EnviraBoard can mitigate one component of construction emissions, with demand for building boards forecast to grow fairly rapidly.
Thank you for reading. You can download the pdf report by clicking here